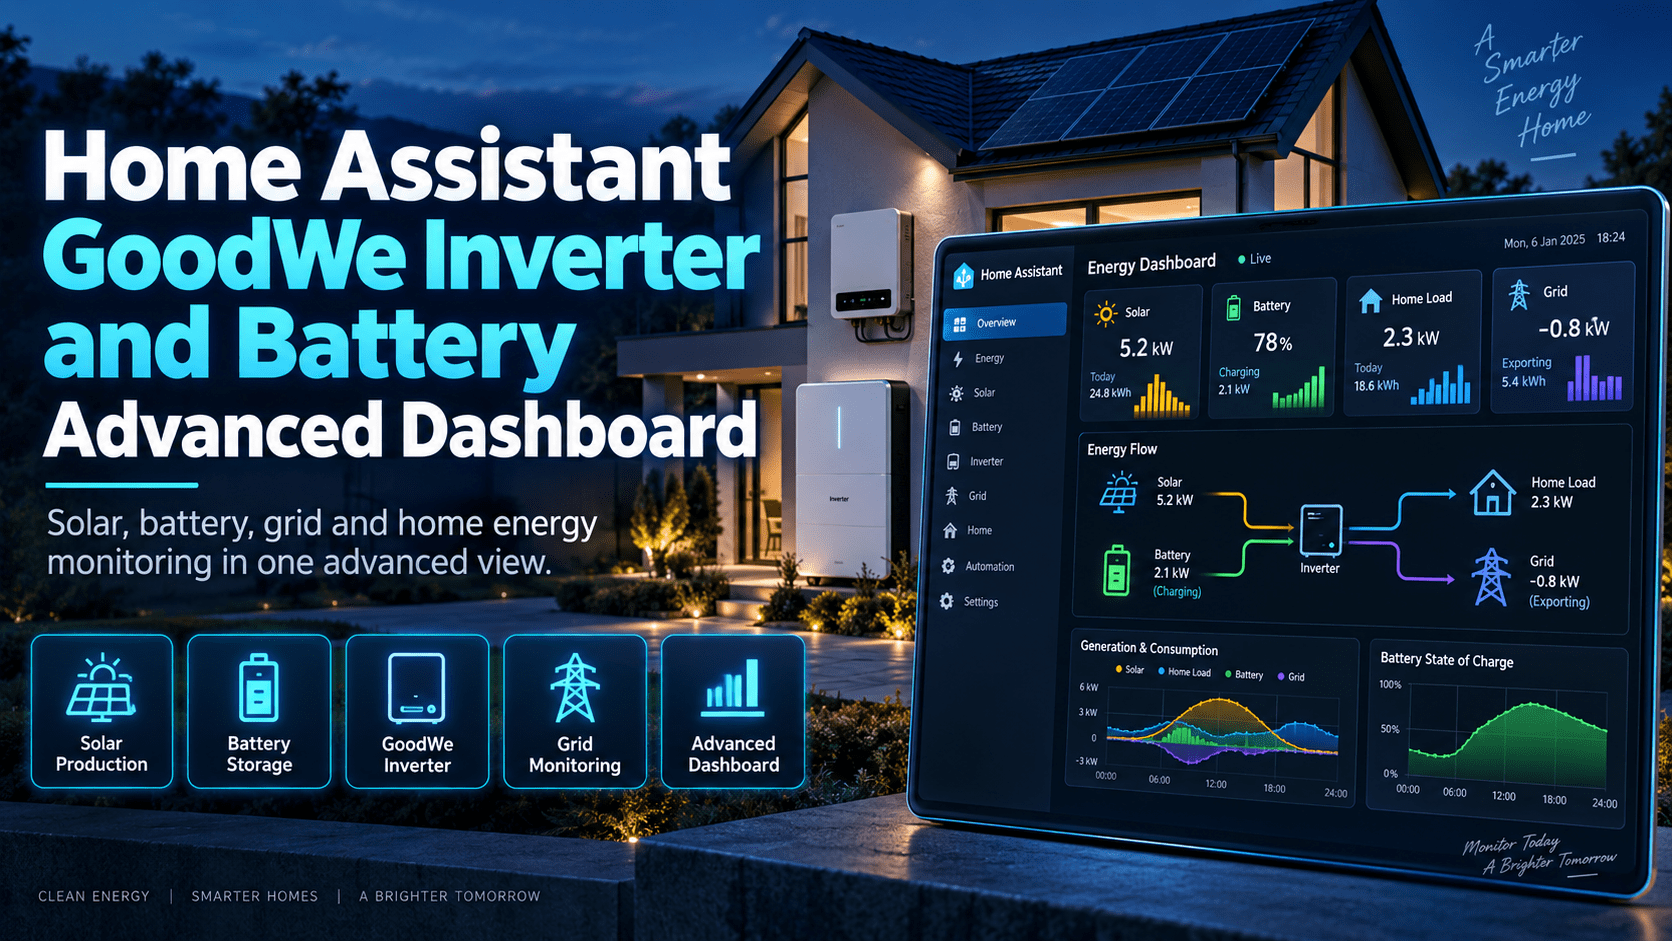
A complete build of a GoodWe hybrid inverter and battery dashboard in Home Assistant: every template sensor, every panel, the automations the data makes possible, and the mistakes made on the way. Entity names are GoodWe’s; the structure, the maths and the traps apply to any inverter with a local connection.
- InverterA GoodWe ET-series hybrid, or any inverter the GoodWe integration or a Modbus integration can read locally. Cloud-only integrations poll too slowly for the live panels.
- Helpers
input_numberentities for battery capacity, array size, performance ratio, tariffs and system cost;utility_meterhelpers for daily, monthly and billing-period totals; astatisticshelper for the 20-minute average discharge rate. - HACS cardsstack-in-card, Mushroom, apexcharts-card, sankey-chart, power-flow-card-plus and card-mod. None changes the data; the sensors are the substance and the cards are presentation.
It is long on purpose. Skim the headings and take the parts you need; nothing later depends on having read everything before it. The GoodWe integration itself, and getting the inverter talking to Home Assistant over Modbus, is covered in the earlier solar and battery monitoring post.
Who it is for. Anyone running a GoodWe ET-series hybrid (or a similar inverter with a local Modbus connection) who has the integration working and now has a hundred-odd entities and no clear idea what to do with them. The entity names here are GoodWe’s. The structure, the traps and the maths apply to any brand.
Most Home Assistant solar dashboards start the same way: install the integration, drop every entity the inverter offers onto a page, and end up with a wall of numbers nobody looks at twice. This is the rebuild of one such page into something denser, faster to read, and right.
The finished view carries 22 panels across 7 columns, 73 entities and 27 live templates. Everything is included below: the template sensors that feed it, the view skeleton, and the YAML for every panel. Only the entity names are specific to this inverter; the structure transfers to any brand.
A note on where the code goes. Template sensors live in configuration.yaml. The dashboard is storage mode, so its YAML is pasted through the dashboard’s three-dot menu ? Edit ? Raw configuration editor, not into ui-lovelace.yaml.
1. What the dashboard had to do
- Answer “what is happening right now” at a glance: generation, house load, battery, grid.
- Answer “was today normal”, which needs a benchmark rather than a bare number.
- Track money against the actual tariff, not a guess.
- Be readable on a phone, because that is where it is usually opened.
2. Before the cards: build the sensor layer
Start here, not with cards. A dashboard is only as good as the sensors behind it, and inverter integrations expose data in shapes convenient for the manufacturer rather than for you. Everything in this section goes under template: in configuration.yaml.
2.1 Establish the sign conventions first
Most hybrid inverters report battery and grid power as a single signed value, and which sign means which direction is not documented reliably. It differs between brands, and sometimes between the two values on the same inverter.
On this system the battery is positive when discharging and the grid is positive when exporting. A second system at another property had the battery the same way round and the grid the opposite. Assuming they pair is how you end up with a flow diagram showing the battery feeding the house while it charges.
Verify each independently, by measurement:
- Find a period with generation at zero and the battery idle. Whatever the house draws must be coming from the grid, so the sign at that moment is unambiguous.
- For the battery, correlate the sign of its power against the direction state-of-charge is moving, over a few hundred samples. Positive power coinciding with falling SoC ninety-odd times and rising SoC never is conclusive.
- Cross-check the identity house load = generation + battery + grid. If it closes to within a watt or two on well-aligned samples, the signs are right.
One caveat: if your inverter computes house load from the other three rather than measuring it, that identity closes by construction whatever your signs are. It then confirms conventions but is useless as an independent check. Know which kind you have.
2.2 Split the signed values into one-directional pairs
Sankey diagrams and flow cards cannot take a negative, and neither can an energy dashboard that wants separate import and export legs. Clamp them into four clean sensors:
- name: GoodWe Battery Charge Power
  unique_id: goodwe_battery_charge_power
  unit_of_measurement: W
  device_class: power
  state_class: measurement
  icon: mdi:battery-plus-variant
  availability: >-
    {{ states('sensor.goodwe_battery_power')
       not in ['unknown', 'unavailable', 'none'] }}
  state: >-
    {{ [ 0 - (states('sensor.goodwe_battery_power') | float(0)), 0 ] | max | round(0) }}

- name: GoodWe Battery Discharge Power
  unique_id: goodwe_battery_discharge_power
  unit_of_measurement: W
  device_class: power
  state_class: measurement
  icon: mdi:battery-minus-variant
  availability: >-
    {{ states('sensor.goodwe_battery_power')
       not in ['unknown', 'unavailable', 'none'] }}
  state: >-
    {{ [ states('sensor.goodwe_battery_power') | float(0), 0 ] | max | round(0) }}

- name: GoodWe Grid Import Power
  unique_id: goodwe_grid_import_power
  unit_of_measurement: W
  device_class: power
  state_class: measurement
  icon: mdi:transmission-tower-import
  availability: >-
    {{ states('sensor.goodwe_active_power')
       not in ['unknown', 'unavailable', 'none'] }}
  state: >-
    {{ [ 0 - (states('sensor.goodwe_active_power') | float(0)), 0 ] | max | round(0) }}

- name: GoodWe Grid Export Power
  unique_id: goodwe_grid_export_power
  unit_of_measurement: W
  device_class: power
  state_class: measurement
  icon: mdi:transmission-tower-export
  availability: >-
    {{ states('sensor.goodwe_active_power')
       not in ['unknown', 'unavailable', 'none'] }}
  state: >-
{{ [ states('sensor.goodwe_active_power') | float(0), 0 ] | max | round(0) }}Note the direction each one clamps. max(x, 0) keeps the positive part; max(-x, 0) keeps the negative part as a positive number. Getting these the wrong way round is silent: the card draws the wrong leg.
2.3 Battery state that means something
Inverters rarely expose pack capacity, so stored energy has to be derived from state-of-charge and a capacity you supply as an input_number:
- name: GoodWe Battery Stored Energy
  unique_id: goodwe_battery_stored_energy
  unit_of_measurement: kWh
  device_class: energy_storage
  state_class: measurement
  icon: mdi:battery-heart-variant
  availability: >-
    {{ states('sensor.goodwe_battery_state_of_charge')
       not in ['unknown', 'unavailable', 'none'] }}
  state: >-
    {{ ( states('sensor.goodwe_battery_state_of_charge') | float(0) / 100
         * states('input_number.goodwe_battery_capacity') | float(0) ) | round(2) }}
The trustworthy charging/discharging readout is derived from the sign of battery power with a deadband, not from the inverter’s own mode text, which lags by a polling interval:
- name: GoodWe Battery Activity
  unique_id: goodwe_battery_activity
  icon: >-
    {% set p = states('sensor.goodwe_battery_power') | float(0) %}
    {% if p > 20 %}mdi:battery-arrow-down
    {% elif p < -20 %}mdi:battery-arrow-up
    {% else %}mdi:battery-heart-variant{% endif %}
  availability: >-
    {{ states('sensor.goodwe_battery_power')
       not in ['unknown', 'unavailable', 'none'] }}
  state: >-
    {% set p = states('sensor.goodwe_battery_power') | float(0) %}
    {% if p > 20 %}Discharging
    {% elif p < -20 %}Charging
    {% else %}Idle{% endif %}
  attributes:
    rate: >-
      {% set p = states('sensor.goodwe_battery_power') | float(0) | abs %}
      {% if p < 1000 %}{{ p | round(0) }} W
      {% else %}{{ (p / 1000) | round(2) }} kW{% endif %}
    time_left: >-
      {% set p = states('sensor.goodwe_battery_power') | float(0) %}
      {% set usable = states('sensor.goodwe_battery_usable_energy') | float(0) %}
      {% set cap = states('input_number.goodwe_battery_capacity') | float(0) %}
      {% set stored = states('sensor.goodwe_battery_stored_energy') | float(0) %}
      {% set dis = states('sensor.battery_discharge_power_avg') | float(0) %}
      {% set chg = states('sensor.battery_charge_power_avg') | float(0) %}
      {% if p > 20 and dis > 50 and usable > 0 %}
        {% set h = usable / (dis / 1000) %}
        {{ h | int }}h {{ '%02d'|format(((h - (h | int)) * 60) | round(0) | int) }}m to grid
      {% elif p < -20 and chg > 50 and cap > stored %}
        {% set h = (cap - stored) / (chg / 1000) %}
        {{ h | int }}h {{ '%02d'|format(((h - (h | int)) * 60) | round(0) | int) }}m to full
      {% elif states('sensor.goodwe_battery_state_of_charge') | float(0) >= 99 %}full
{% else %}steady{% endif %}A naming trap worth knowing: the integration already owned sensor.goodwe_battery_status, so a template named “GoodWe Battery Status” silently landed as ..._status_2. Check for an existing entity before naming a template sensor after an inverter concept.
2.4 Battery runtime forecast
“When does the battery run out” is a useful number, and it must use a rolling average discharge rate rather than the instantaneous figure. Spot draw swings by kilowatts as appliances cycle, which made the estimate jump by hours. A statistics helper holding a 20-minute mean fixes it. The sensor is availability-gated so it emits nothing rather than nonsense before the helper has samples:
- name: GoodWe Battery Runs Out
  unique_id: goodwe_battery_runs_out
  device_class: timestamp
  icon: mdi:transmission-tower-import
  availability: >-
    {{ states('sensor.goodwe_battery_power') | float(0) > 20
       and states('sensor.battery_discharge_power_avg') | float(0) > 50
       and states('sensor.goodwe_battery_usable_energy') | float(0) > 0 }}
  state: >-
    {% set usable = states('sensor.goodwe_battery_usable_energy') | float(0) %}
    {% set dis = states('sensor.battery_discharge_power_avg') | float(0) / 1000 %}
    {{ (now() + timedelta(hours = [usable / dis, 240] | min)).isoformat() }}
  attributes:
    hours_remaining: >-
      {% set usable = states('sensor.goodwe_battery_usable_energy') | float(0) %}
      {% set dis = states('sensor.battery_discharge_power_avg') | float(0) / 1000 %}
      {{ (usable / dis) | round(2) if dis > 0.05 else 'unknown' }}
    avg_draw: >-
      {% set d = states('sensor.battery_discharge_power_avg') | float(0) %}
      {% if d < 1000 %}{{ d | round(0) }} W{% else %}{{ (d/1000) | round(2) }} kW{% endif %}
    usable_kwh: "{{ states('sensor.goodwe_battery_usable_energy') }}"
    floor_pct: >-
      {{ 100 - states('number.goodwe_depth_of_discharge_on_grid') | float(90) }}
2.5 Sun position: which cannot be charted directly
sun.sun exposes elevation and azimuth as attributes, and its state changes only twice a day. The recorder therefore holds two rows per day and none of them carries an elevation value, so the entity cannot be charted. Two template sensors fix that and are recorded properly:
- name: "Sun Elevation"
  unique_id: sun_elevation
  unit_of_measurement: "°"
  state_class: measurement
  icon: mdi:weather-sunny
  state: "{{ state_attr('sun.sun','elevation') | float(0) | round(2) }}"
  availability: "{{ state_attr('sun.sun','elevation') is not none }}"

- name: "Sun Azimuth"
  unique_id: sun_azimuth
  unit_of_measurement: "°"
  state_class: measurement
  icon: mdi:compass-outline
  state: "{{ state_attr('sun.sun','azimuth') | float(0) | round(2) }}"
  availability: "{{ state_attr('sun.sun','azimuth') is not none }}"
  attributes:
    direction: >
      {% set a = state_attr('sun.sun','azimuth') | float(0) %}
      {% set pts = ['N','NNE','NE','ENE','E','ESE','SE','SSE',
                    'S','SSW','SW','WSW','W','WNW','NW','NNW'] %}
      {{ pts[((a / 22.5) | round(0, 'common') | int) % 16] }}
2.6 The clear-sky benchmark
“18 kWh today” means nothing alone. It needs a ceiling. The useful question is “how much of what was available did we capture?”
You do not need a weather API. Extraterrestrial radiation on a horizontal surface is pure geometry: latitude and day of year. Multiply that by a clear-sky transmission factor of about 0.75, the array size in kWp and a performance ratio, and you have a daily ceiling that validates well against real output:
- name: Solar Clear Sky Today
  unique_id: solar_clear_sky_today
  unit_of_measurement: kWh
  device_class: energy
  icon: mdi:white-balance-sunny
  state: >-
    {% set lat_r = state_attr('zone.home','latitude') | float(-27.8254) * pi / 180 %}
    {% set doy = now().timetuple().tm_yday %}
    {% set decl = 23.45 * sin(2*pi*(284+doy)/365) * pi/180 %}
    {% set x = [[ -tan(lat_r)*tan(decl), -1] | max, 1] | min %}
    {% set ws = acos(x) %}
    {% set H0 = (24*3600*1367/pi) * (1+0.033*cos(2*pi*doy/365))
                * (cos(lat_r)*cos(decl)*sin(ws) + ws*sin(lat_r)*sin(decl)) %}
    {% set psh = H0/3600000 * 0.75 %}
    {{ (psh * states('input_number.solar_array_size') | float(10.8)
            * states('input_number.solar_performance_ratio') | float(0.8)) | round(1) }}
  attributes:
    peak_sun_hours: >-
      {% set lat_r = state_attr('zone.home','latitude') | float(-27.8254) * pi / 180 %}
      {% set doy = now().timetuple().tm_yday %}
      {% set decl = 23.45 * sin(2*pi*(284+doy)/365) * pi/180 %}
      {% set x = [[ -tan(lat_r)*tan(decl), -1] | max, 1] | min %}
      {% set ws = acos(x) %}
      {% set H0 = (24*3600*1367/pi) * (1+0.033*cos(2*pi*doy/365))
                  * (cos(lat_r)*cos(decl)*sin(ws) + ws*sin(lat_r)*sin(decl)) %}
      {{ (H0/3600000*0.75) | round(2) }}
    daylight_hours: >-
      {% set lat_r = state_attr('zone.home','latitude') | float(-27.8254) * pi / 180 %}
      {% set doy = now().timetuple().tm_yday %}
      {% set decl = 23.45 * sin(2*pi*(284+doy)/365) * pi/180 %}
      {% set x = [[ -tan(lat_r)*tan(decl), -1] | max, 1] | min %}
      {{ (acos(x)*180/pi*2/15) | round(2) }}
- name: Solar Capture Today
  unique_id: solar_capture_today
  unit_of_measurement: '%'
  state_class: measurement
  icon: mdi:gauge
  availability: >-
    {{ states('sensor.goodwe_today_s_pv_generation') not in ['unknown','unavailable']
       and states('sensor.solar_clear_sky_today') | float(0) > 0 }}
  state: >-
    {{ ( states('sensor.goodwe_today_s_pv_generation') | float(0)
         / states('sensor.solar_clear_sky_today') | float(1) * 100 ) | round(0) }}

- name: Solar Shortfall Today
  unique_id: solar_shortfall_today
  unit_of_measurement: kWh
  device_class: energy
  icon: mdi:weather-cloudy-alert
  state: >-
    {{ [ states('sensor.solar_clear_sky_today') | float(0)
- states('sensor.goodwe_today_s_pv_generation') | float(0), 0 ] | max | round(1) }}A performance ratio of 0.80 is a reasonable physical default. Capture reads 75-97% here, and a sagging figure does mean cloud.
Treat an impossible percentage as a calibration fault
This one cost a week on a second site: if capture exceeds 100%, the model is wrong, not the day. A ceiling you routinely beat is not a ceiling. There the array size had been set to half its true value and the view reported 119%, 142%, 122%, 134%, 134%, 135% and 132% on seven consecutive days before anyone questioned it. The same rule applies to any derived figure that goes physically impossible: negative house load, efficiency above unity, a battery delivering more than its capacity.
What deliberately was not built
An “expected power right now” sensor is tempting and was left out. Measured against sun elevation, instantaneous PV correlates well (r = 0.88 over ~11,000 samples), but the ceiling saturates above about 40° elevation while a simple model keeps climbing. Fitting the mean and presenting it as a maximum would produce a capture figure wrong through the middle of every clear day.
The cause turned out to be physical: this array is split across two roof faces whose peaks are about three and three-quarter hours apart, so the combined curve is broad and flat-topped rather than peaked. A single-azimuth model can never fit a split array. The daily figure is unaffected because integrating over the whole day mostly cancels the split out.
2.7 Tomorrow’s forecast needs a trigger template
A weather forecast requires a service call, which a plain template sensor cannot make. That makes this a trigger-based template, refreshed on a time pattern and at startup:
The wrapper looks like this. One fetch feeds any number of sensors beneath it:
- trigger:
    - platform: homeassistant
      event: start
    - platform: time_pattern
      minutes: "/30"
  action:
    - service: weather.get_forecasts
      target:
        entity_id: weather.home        # your own weather entity
      data:
        type: daily
      response_variable: fc
  sensor:
    - name: Solar Forecast Tomorrow
      ...
And the sensor itself:
- name: Solar Forecast Tomorrow
  unique_id: solar_forecast_tomorrow
  unit_of_measurement: kWh
  device_class: energy
  icon: mdi:weather-partly-cloudy
  state: >-
    {% set lat_r = state_attr('zone.home','latitude') | float(-27.8254) * pi / 180 %}
    {% set doy = (now() + timedelta(days=1)).timetuple().tm_yday %}
    {% set decl = 23.45 * sin(2*pi*(284+doy)/365) * pi/180 %}
    {% set x = [[ -tan(lat_r)*tan(decl), -1] | max, 1] | min %}
    {% set ws = acos(x) %}
    {% set H0 = (24*3600*1367/pi) * (1+0.033*cos(2*pi*doy/365))
                * (cos(lat_r)*cos(decl)*sin(ws) + ws*sin(lat_r)*sin(decl)) %}
    {% set clear = H0/3600000 * 0.75
                   * states('input_number.solar_array_size') | float(10.8)
                   * states('input_number.solar_performance_ratio') | float(0.8) %}
    {% set f = {'sunny':0.95,'clear-night':0.95,'partlycloudy':0.75,'cloudy':0.45,
                'rainy':0.30,'pouring':0.22,'lightning':0.30,'lightning-rainy':0.28,
                'fog':0.35,'hail':0.30,'snowy':0.30,'snowy-rainy':0.28,
                'windy':0.90,'windy-variant':0.85,'exceptional':0.60} %}
    {% set fl = fc['weather.home'].forecast if fc is defined else [] %}
    {% set tom = (now() + timedelta(days=1)).date() | string %}
    {% set m = fl | selectattr('datetime','search',tom) | list %}
    {% set cond = m[0].condition if m else 'partlycloudy' %}
    {{ (clear * f.get(cond, 0.6)) | round(1) }}
  attributes:
    condition: >-
      {% set fl = fc['weather.home'].forecast if fc is defined else [] %}
      {% set tom = (now() + timedelta(days=1)).date() | string %}
      {% set m = fl | selectattr('datetime','search',tom) | list %}
{{ m[0].condition if m else 'unknown' }}It reads unknown until the first trigger fires, so add the homeassistant: start trigger alongside the time pattern or it stays blank until the next half hour after every restart.
The condition-to-factor map is the whole model: a clear-sky ceiling multiplied by how much of it a given sky is likely to let through. Crude, and close enough to plan a wash load around.
2.8 Tariffs and cost
Rates live in input_number helpers rather than being hard-coded, so one edit updates both these sensors and Home Assistant’s native energy dashboard.
Reconcile against a real bill, to the cent
Both the import rate and the feed-in tariff here were first set from memory and both were wrong. Take a bill and check every line multiplies out exactly. It also tells you something you cannot guess: whether the printed rates already include tax. Divide each by 1.1. If every one gives a clean four-decimal figure, they are tax-inclusive and you must not add it again. Two properties in this household are opposite ways round, so never copy a rate between sites.
Tax applies to charges, never to the feed-in credit
(usage + supply) x 1.1 - credit = amount dueApplying tax to the net figure does not reconcile. In the energy dashboard settings that means the import price entity must be tax-inclusive while export stays raw. That is what this sensor is for:
- name: Electricity Import Price Incl GST
  unique_id: electricity_import_price_incl_gst
  unit_of_measurement: AUD/kWh
  icon: mdi:cash-plus
  availability: >-
    {{ states('input_number.electricity_import_rate') | is_number
       and states('input_number.electricity_gst_rate') | is_number }}
  state: >-
    {{ ( states('input_number.electricity_import_rate') | float
         * (1 + states('input_number.electricity_gst_rate') | float / 100) ) | round(5) }}
This was wired to the raw ex-tax helper for three weeks and every import cost ran 9.1% low. The template sensors on the same page were right, which is what made it hard to spot.
The daily cost chain:
- name: Electricity Cost Today
  unique_id: electricity_cost_today
  unit_of_measurement: AUD
  device_class: monetary
  state_class: total
  icon: mdi:cash-minus
  availability: >-
    {{ states('input_number.electricity_import_rate')
       not in ['unknown','unavailable','none'] }}
  state: >-
    {% set gst = 1 + states('input_number.electricity_gst_rate') | float(0) / 100 %}
    {{ ( ( states('sensor.grid_import_daily') | float(0)
           * states('input_number.electricity_import_rate') | float(0)
           + states('input_number.electricity_daily_supply_charge') | float(0) )
         * gst ) | round(2) }}
  attributes:
    usage_charge: >-
      {{ ( states('sensor.grid_import_daily') | float(0)
           * states('input_number.electricity_import_rate') | float(0) ) | round(2) }}
    supply_charge: "{{ states('input_number.electricity_daily_supply_charge') | float(0) | round(2) }}"
    gst: >-
      {{ ( ( states('sensor.grid_import_daily') | float(0)
             * states('input_number.electricity_import_rate') | float(0)
             + states('input_number.electricity_daily_supply_charge') | float(0) )
           * states('input_number.electricity_gst_rate') | float(0) / 100 ) | round(2) }}

- name: Electricity Credit Today
  unique_id: electricity_credit_today
  unit_of_measurement: AUD
  device_class: monetary
  state_class: total
  icon: mdi:cash-plus
  availability: >-
    {{ states('input_number.electricity_feed_in_tariff')
       not in ['unknown','unavailable','none'] }}
  state: >-
    {{ ( states('sensor.grid_export_daily') | float(0)
         * states('input_number.electricity_feed_in_tariff') | float(0) ) | round(2) }}
- name: Electricity Net Today
  unique_id: electricity_net_today
  unit_of_measurement: AUD
  device_class: monetary
  state_class: total
  icon: mdi:scale-balance
  availability: >-
    {{ states('sensor.electricity_cost_today')
       not in ['unknown','unavailable','none'] }}
  state: >-
    {{ ( states('sensor.electricity_cost_today') | float(0)
         - states('sensor.electricity_credit_today') | float(0) ) | round(2) }}

- name: Electricity Savings Today
  unique_id: electricity_savings_today
  unit_of_measurement: AUD
  device_class: monetary
  state_class: total
  icon: mdi:piggy-bank
  availability: >-
    {{ states('sensor.goodwe_today_load') not in ['unknown','unavailable','none'] }}
  state: >-
    {% set gst = 1 + states('input_number.electricity_gst_rate') | float(0) / 100 %}
    {% set nosolar = ( states('sensor.goodwe_today_load') | float(0)
                       * states('input_number.electricity_import_rate') | float(0)
                       + states('input_number.electricity_daily_supply_charge') | float(0) ) * gst %}
    {{ ( nosolar - states('sensor.electricity_net_today') | float(0) ) | round(2) }}
  attributes:
    cost_without_solar: >-
      {% set gst = 1 + states('input_number.electricity_gst_rate') | float(0) / 100 %}
      {{ ( ( states('sensor.goodwe_today_load') | float(0)
             * states('input_number.electricity_import_rate') | float(0)
+ states('input_number.electricity_daily_supply_charge') | float(0) ) * gst ) | round(2) }}The savings baseline must compare like with like. An early version charged a fixed daily supply fee on the actual-cost side but left it off the “without solar” side, so savings were understated by the whole supply charge and went negative every morning. Solar offsets neither a supply charge nor a separate controlled-load circuit, so both belong on both sides, where they cancel.
2.9 Billing periods rarely match calendar months
This bill runs the 11th to the 10th. Three things follow:
- Daily and monthly totals come from
utility_meterhelpers on the meter registers. - The billing total uses a
monthlycycle withoffset: 10, so it resets at midnight on the 11th. - Quarterly cycles are calendar quarters and
offsetcaps at 28 days, so a quarter starting in September cannot be expressed that way at all. Usecycle: noneand zero the meter from an automation.
Also set periodically_resetting: true when the source itself resets at midnight, or the meter treats the drop as an error. And note a utility meter inherits its source’s device name, so the entity ID it lands on is often not the one you expected, so check and rename it afterwards.
- name: Electricity Billing Period
  unique_id: electricity_billing_period
  icon: mdi:calendar-range
  state: >-
    {% set d = now() %}
    {% set start = d.replace(day=11) if d.day >= 11
                   else (d.replace(day=1) - timedelta(days=1)).replace(day=11) %}
    {{ start.strftime('%-d %b') }} - {{ ((start.replace(day=28) + timedelta(days=8)).replace(day=10)).strftime('%-d %b') }}
  attributes:
    days_elapsed: >-
      {% set d = now() %}
      {% set start = d.replace(day=11) if d.day >= 11
                     else (d.replace(day=1) - timedelta(days=1)).replace(day=11) %}
      {{ ((d - start).days + 1) }}
    days_total: >-
      {% set d = now() %}
      {% set start = d.replace(day=11) if d.day >= 11
                     else (d.replace(day=1) - timedelta(days=1)).replace(day=11) %}
      {% set end = (start.replace(day=28) + timedelta(days=8)).replace(day=10) %}
      {{ (end - start).days + 1 }}
    days_left: >-
      {% set d = now() %}
      {% set start = d.replace(day=11) if d.day >= 11
                     else (d.replace(day=1) - timedelta(days=1)).replace(day=11) %}
      {% set end = (start.replace(day=28) + timedelta(days=8)).replace(day=10) %}
      {{ [(end - d).days, 0] | max }}
- name: Electricity Bill To Date
  unique_id: electricity_bill_to_date
  unit_of_measurement: AUD
  device_class: monetary
  state_class: total
  icon: mdi:receipt-text
  state: >-
    {% set rate = states('input_number.electricity_import_rate') | float(0) %}
    {% set fit  = states('input_number.electricity_feed_in_tariff') | float(0) %}
    {% set sup  = states('input_number.electricity_daily_supply_charge') | float(0) %}
    {% set gst  = 1 + states('input_number.electricity_gst_rate') | float(0) / 100 %}
    {% set days = state_attr('sensor.electricity_billing_period','days_elapsed') | int(1) %}
    {% set imp  = states('sensor.grid_import_billing') | float(0) %}
    {% set exp  = states('sensor.grid_export_billing') | float(0) %}
    {{ ((imp * rate + sup * days) * gst - exp * fit) | round(2) }}

- name: Electricity Bill Projected
  unique_id: electricity_bill_projected
  unit_of_measurement: AUD
  device_class: monetary
  state_class: total
  icon: mdi:crystal-ball
  state: >-
    {% set rate = states('input_number.electricity_import_rate') | float(0) %}
    {% set fit  = states('input_number.electricity_feed_in_tariff') | float(0) %}
    {% set sup  = states('input_number.electricity_daily_supply_charge') | float(0) %}
    {% set gst  = 1 + states('input_number.electricity_gst_rate') | float(0) / 100 %}
    {% set el   = state_attr('sensor.electricity_billing_period','days_elapsed') | int(1) %}
    {% set tot  = state_attr('sensor.electricity_billing_period','days_total') | int(30) %}
    {% set imp  = states('sensor.grid_import_billing') | float(0) / el * tot %}
    {% set exp  = states('sensor.grid_export_billing') | float(0) / el * tot %}
    {{ ((imp * rate + sup * tot) * gst - exp * fit) | round(2) }}
  attributes:
    projected_import_kwh: >-
      {% set el = state_attr('sensor.electricity_billing_period','days_elapsed') | int(1) %}
      {% set tot = state_attr('sensor.electricity_billing_period','days_total') | int(30) %}
      {{ (states('sensor.grid_import_billing') | float(0) / el * tot) | round(1) }}
    projected_export_kwh: >-
      {% set el = state_attr('sensor.electricity_billing_period','days_elapsed') | int(1) %}
      {% set tot = state_attr('sensor.electricity_billing_period','days_total') | int(30) %}
      {{ (states('sensor.grid_export_billing') | float(0) / el * tot) | round(1) }}
    basis: >-
      {{ state_attr('sensor.electricity_billing_period','days_elapsed') }} of
{{ state_attr('sensor.electricity_billing_period','days_total') }} days2.10 Lifetime savings and payback
- name: Solar Lifetime Savings
  unique_id: solar_lifetime_savings
  unit_of_measurement: AUD
  device_class: monetary
  state_class: total
  icon: mdi:cash-check
  availability: >-
    {{ states('sensor.goodwe_total_load') not in ['unknown','unavailable','none'] }}
  state: >-
    {% set rate = states('input_number.electricity_import_rate') | float(0) %}
    {% set fit  = states('input_number.electricity_feed_in_tariff') | float(0) %}
    {% set load = states('sensor.goodwe_total_load') | float(0) %}
    {% set imp  = states('sensor.goodwe_meter_total_energy_import') | float(0) %}
    {% set exp  = states('sensor.goodwe_meter_total_energy_export') | float(0) %}
    {% set gst = 1 + states('input_number.electricity_gst_rate') | float(0) / 100 %}
    {{ ( load * rate * gst - (imp * rate * gst - exp * fit) ) | round(2) }}
- name: Solar Payback Remaining
  unique_id: solar_payback_remaining
  unit_of_measurement: AUD
  device_class: monetary
  state_class: total
  icon: mdi:progress-clock
  availability: >-
    {{ states('sensor.solar_lifetime_savings') not in ['unknown','unavailable','none'] }}
  state: >-
    {{ [ states('input_number.solar_system_cost') | float(0)
         - states('sensor.solar_lifetime_savings') | float(0), 0 ] | max | round(2) }}

- name: Solar Payback Progress
  unique_id: solar_payback_progress
  unit_of_measurement: "%"
  state_class: measurement
  icon: mdi:percent
  availability: >-
    {{ states('sensor.solar_lifetime_savings') not in ['unknown','unavailable','none'] }}
  state: >-
    {% set cost = states('input_number.solar_system_cost') | float(0) %}
    {% if cost > 0 %}
      {{ ( states('sensor.solar_lifetime_savings') | float(0) / cost * 100 ) | round(2) }}
    {% else %}0{% endif %}
- name: Solar Payback ETA
  unique_id: solar_payback_eta
  device_class: timestamp
  icon: mdi:calendar-check
  availability: >-
    {% set d = (now().date() - strptime(states('input_datetime.solar_install_date'),
                '%Y-%m-%d').date()).days %}
    {{ states('sensor.solar_lifetime_savings') not in ['unknown','unavailable','none']
       and d >= 1
       and states('sensor.solar_lifetime_savings') | float(0) > 0 }}
  state: >-
    {% set days = [ (now().date() - strptime(states('input_datetime.solar_install_date'),
                     '%Y-%m-%d').date()).days, 1 ] | max %}
    {% set avg  = states('sensor.solar_lifetime_savings') | float(0) / days %}
    {% set left = states('sensor.solar_payback_remaining') | float(0) %}
    {{ (now() + timedelta(days = [left / avg, 36500] | min )).isoformat() }}
  attributes:
    days_running: >-
      {{ [ (now().date() - strptime(states('input_datetime.solar_install_date'),
           '%Y-%m-%d').date()).days, 1 ] | max }}
    avg_per_day: >-
      {% set days = [ (now().date() - strptime(states('input_datetime.solar_install_date'),
                       '%Y-%m-%d').date()).days, 1 ] | max %}
      {{ ( states('sensor.solar_lifetime_savings') | float(0) / days ) | round(2) }}
    years_remaining: >-
      {% set days = [ (now().date() - strptime(states('input_datetime.solar_install_date'),
                       '%Y-%m-%d').date()).days, 1 ] | max %}
      {% set avg  = states('sensor.solar_lifetime_savings') | float(0) / days %}
      {% if avg > 0 %}
        {{ ( states('sensor.solar_payback_remaining') | float(0) / avg / 365.25 ) | round(1) }}
{% else %}unknown{% endif %}3. Layout: columns, not sections
This is where most dense dashboards fall down, and the fix is structural.
A sections view is a CSS grid, not masonry. Every row sizes to its tallest member, so a three-card section beside a thirteen-card section gives you a column of whitespace as tall as the difference. No amount of dense_section_placement fixes it; that option only fills gaps left by spanning sections.
Stop thinking in rows. Instead of one section per panel, use a small number of full-height column sections, each holding a vertical stack of panels. A column is an independent stack that just grows, so there are no rows and therefore no row-height whitespace.
title: Energy
path: energy
icon: mdi:solar-power-variant
type: sections
max_columns: 7
dense_section_placement: true
sections:
  - type: grid          # each section is one full-height COLUMN
    column_span: 1
cards: [ ... panels, stacked vertically ... ]| Column | Panels |
|---|---|
| 1 | Battery headline · live power flow · today’s energy sankey |
| 2 | System overview · live PV · sun vs PV · PV strings · clear-sky performance |
| 3 | Live power sankey · sources of energy today · power over 48 hours |
| 4 | Storage & thermals · battery performance · settings & tariff |
| 5 | AC & inverter · grid & energy flow |
| 6 | Cost & billing · payback |
| 7 | The four native energy cards |
Column order is your only lever for mobile
On a phone a sections view collapses to one column and renders sections in order. Nothing else decides what appears first: not card position within a panel, not grid options. The most important number goes in the first panel of the first column.
Keep spans to 1 and 2
A column_span must never exceed max_columns. This breaks latently rather than obviously: a section spanning 5 in a 4-column grid renders its heading in one column and its cards in another, which reads like the layout has come apart rather than like a width error. Since max_columns is a display setting a user can change, a span of 2 is the only one that survives every width.
4. The panel idiom
Every panel is the same three-part construction, welded into one card: header, chart, tile grid.
type: custom:stack-in-card
cards:
  - type: custom:mushroom-template-card     # header: ALL-CAPS name + live status line
  - type: custom:apexcharts-card            # the chart, if the panel has one
  - type: grid                              # a 2-or-3-wide grid of mushroom cards
    columns: 2
The templated second line of the header is what makes the idiom worth the effort: a glanced-at panel still tells you something.
Two traps inside stack-in-card
stack-in-card builds its children with createCardElement and does not wrap them in Home Assistant’s own hui-card. Two silent consequences:
grid_optionson a nested card is ignored. Width falls back to the frontend default. Cards that support their own sizing still work, such asaspect_ratioon a map orheighton a chart.- The native
visibility:option is ignored too, with nothing logged. A control you meant to hide stays on screen. Use aconditionalcard, which hides itself internally and therefore works at any depth.
card-mod does work inside a stack, because it patches each card’s own setConfig rather than relying on the wrapper.
5. Panel by panel
Every panel on the view, with the YAML that produces it.
Column 1: what you see first, and what a phone shows first
BATTERY (headline)
State of charge as a filled arc, not a needle. This is a level, and severity colours are meaningful on it: low really is bad. The header templates the live charge/discharge rate from the activity sensor built in section 2.3.
type: custom:stack-in-card
cards:
  - type: custom:mushroom-template-card
    primary: '{{ states(''sensor.goodwe_battery_state_of_charge'') }}% BATTERY'
    secondary: '{{ states(''sensor.goodwe_battery_activity'') }} · {{ states(''sensor.goodwe_battery_stored_energy'') }} kWh stored · runs out {{ as_timestamp(states(''sensor.goodwe_battery_runs_out''),0) | timestamp_custom(''%-I:%M %p'', true, ''n/a'') }}'
    icon: '{% set s = states(''sensor.goodwe_battery_state_of_charge'') | int(0) %}{% set chg = ''Charging'' in states(''sensor.goodwe_battery_activity'') %}{% set lvl = (s / 10) | round | int * 10 %}{% if lvl >= 100 %}mdi:battery{{ ''-charging-100'' if chg else '''' }}{% elif lvl <= 0 %}mdi:battery-outline{% else %}mdi:battery{{ ''-charging'' if chg else '''' }}-{{ lvl }}{% endif %}'
    icon_color: '{% set s = states(''sensor.goodwe_battery_state_of_charge'')|int(0) %}{{ ''red'' if s < 20 else ''orange'' if s < 50 else ''green'' }}'
    multiline_secondary: true
  - type: gauge
    entity: sensor.goodwe_battery_state_of_charge
    name: State of charge
    min: 0
    max: 100
    needle: false
    severity:
      green: 50
      yellow: 20
      red: 0
    grid_options:
      columns: 12
  - type: grid
    columns: 2
    square: false
    cards:
      - type: custom:mushroom-entity-card
        entity: sensor.goodwe_battery_stored_energy
        name: Stored
        icon: mdi:battery-high
        icon_color: green
      - type: custom:mushroom-entity-card
        entity: sensor.goodwe_battery_usable_energy
        name: Usable
        icon: mdi:battery-heart-variant
        icon_color: teal
grid_options:
columns: 12LIVE POWER FLOW
power-flow-card-plus animates generation, house, battery and grid. This is where the sign conventions bite. The card reads the positive part of a signed sensor for import and the negative part for battery charging, so on this inverter the grid leg needs invert_state: true and the battery leg must not have it. If a direction ever looks wrong, grep the card bundle for its fromGrid: / fromBattery: getters rather than reasoning from the option names.
type: custom:stack-in-card
cards:
  - type: custom:mushroom-template-card
    primary: LIVE POWER FLOW
    secondary: Solar {{ states('sensor.goodwe_pv_power_total') }} W · house {{ states('sensor.goodwe_house_consumption') }} W · grid {{ states('sensor.goodwe_active_power') }} W
    icon: mdi:transit-connection-variant
    icon_color: cyan
  - type: custom:power-flow-card-plus
    entities:
      grid:
        entity: sensor.goodwe_active_power
        invert_state: true
        name: Grid
      solar:
        entity: sensor.goodwe_pv_power
        name: Solar
      battery:
        entity: sensor.goodwe_battery_power
        state_of_charge: sensor.goodwe_battery_state_of_charge
        name: Battery
      home:
        entity: sensor.goodwe_house_consumption
        name: House
    clickable_entities: true
    watt_threshold: 1000
    display_zero_lines:
      mode: show
    grid_options:
      columns: 12
grid_options:
columns: 12ENERGY FLOW: TODAY (sankey)
Built entirely from already-one-directional daily totals, so it is immune to sign convention questions. A sankey cannot take a negative, which is why the split sensors from section 2.2 exist.
type: custom:sankey-chart
title: Energy flow — today
unit: Wh
unit_prefix: k
round: 1
height: 230
show_names: true
show_icons: false
min_box_height: 3
grid_options:
  columns: 12
sections:
  - entities:
      - entity_id: sensor.goodwe_today_s_pv_generation
        name: Solar
        color: '#ff9800'
        children:
          - sensor.goodwe_today_load
          - sensor.battery_charged_daily
          - sensor.grid_export_daily
      - entity_id: sensor.grid_import_daily
        name: Grid in
        color: '#2196f3'
        children:
          - sensor.goodwe_today_load
      - entity_id: sensor.battery_discharged_daily
        name: Battery out
        color: '#4caf50'
        children:
          - sensor.goodwe_today_load
  - entities:
      - entity_id: sensor.goodwe_today_load
        name: House
        color: '#00bcd4'
      - entity_id: sensor.battery_charged_daily
        name: Battery in
        color: '#4caf50'
      - entity_id: sensor.grid_export_daily
        name: Grid out
color: '#9c27b0'Column 2: solar performance
SYSTEM OVERVIEW
Plain status tiles: inverter mode, PV total, house load, and the derived battery activity readout.
type: custom:stack-in-card
cards:
  - type: custom:mushroom-template-card
    primary: SYSTEM OVERVIEW
    secondary: 'Mode: {{ states(''select.goodwe_inverter_operation_mode'') }} | Battery {{ states(''sensor.goodwe_battery_state_of_charge'') }}% | {{ states(''sensor.goodwe_battery_activity'') }}'
    icon: mdi:solar-power-variant
    icon_color: amber
  - type: grid
    columns: 2
    square: false
    cards:
      - type: custom:mushroom-entity-card
        entity: sensor.goodwe_pv_power_total
        name: PV now
        icon: mdi:solar-power
        icon_color: yellow
      - type: custom:mushroom-entity-card
        entity: sensor.goodwe_battery_state_of_charge
        name: SoC
        icon: mdi:battery-high
        icon_color: green
      - type: custom:mushroom-entity-card
        entity: sensor.goodwe_house_consumption
        name: House now
        icon: mdi:home-lightning-bolt
        icon_color: blue
      - type: custom:mushroom-entity-card
        entity: sensor.goodwe_active_power
        name: Grid now
        icon: mdi:transmission-tower
        icon_color: purple
grid_options:
columns: 12LIVE PV OUTPUT
Today’s generation curve. group_by with func: avg over five minutes keeps the series light without visibly smoothing the shape.
type: custom:stack-in-card
cards:
  - type: custom:mushroom-template-card
    primary: LIVE PV OUTPUT
    secondary: Today {{ states('sensor.goodwe_today_s_pv_generation') }} kWh of a {{ states('sensor.solar_clear_sky_today') }} kWh clear-sky ceiling ({{ states('sensor.solar_capture_today') }}%)
    icon: mdi:weather-sunny
    icon_color: yellow
  - type: custom:apexcharts-card
    header:
      show: true
      title: Live PV production
    graph_span: 6h
    apex_config:
      chart:
        height: 230
      stroke:
        width: 2
        curve: smooth
      dataLabels:
        enabled: false
      legend:
        show: false
        position: bottom
      xaxis:
        labels:
          datetimeUTC: false
    series:
      - entity: sensor.goodwe_pv_power_total
        name: PV
        color: '#facc15'
        type: area
        group_by:
          func: avg
          duration: 1min
    update_interval: 30s
  - type: grid
    columns: 2
    square: false
    cards:
      - type: custom:mushroom-entity-card
        entity: sensor.goodwe_today_s_pv_generation
        name: PV today
        icon: mdi:solar-power
        icon_color: yellow
      - type: custom:mushroom-entity-card
        entity: sensor.goodwe_total_pv_generation
        name: PV total
        icon: mdi:chart-line
        icon_color: amber
grid_options:
columns: 12SUN vs PV
PV power on the left axis, sun elevation on the right. Measured before building it: PV against sin(elevation) scores r = 0.88 over 10,910 samples, so the two belong on one chart. A sagging PV curve under a smooth elevation curve is cloud; both falling together is just the end of the day. That single read is what the panel is for.
Chart mechanics: two y-axes, and once yaxis[] uses ids, every series needs a yaxis_id or apexcharts-card throws.
type: custom:stack-in-card
grid_options:
  columns: 12
cards:
  - type: custom:mushroom-template-card
    primary: SUN vs PV
    icon: mdi:solar-power-variant
    icon_color: '{{ ''amber'' if states(''sensor.sun_elevation'') | float(-90) > 10 else ''disabled'' }}'
    secondary: '{% set el = states(''sensor.sun_elevation'') | float(-90) %}{% set ss = states(''sensor.sun_next_setting'') | as_datetime %}Sun {{ el | round }}° {{ state_attr(''sensor.sun_azimuth'',''direction'') }} · PV {{ (states(''sensor.goodwe_pv_power'') | float(0) / 1000) | round(2) }} kW{% if el > 0 and ss %} · {{ ((ss - now()).total_seconds() / 60) | round }} min to sunset{% elif el <= 0 %} · below horizon, no generation{% endif %}'
  - type: custom:apexcharts-card
    header:
      show: true
      title: PV against sun elevation - 24 h
      show_states: false
    graph_span: 24h
    update_interval: 2min
    apex_config:
      chart:
        height: 230
      stroke:
        width:
          - 0
          - 2
        curve: smooth
      dataLabels:
        enabled: false
      legend:
        show: true
        position: bottom
      xaxis:
        labels:
          datetimeUTC: false
      tooltip:
        x:
          format: ddd HH:mm
    yaxis:
      - id: pw
        decimals: 0
        min: 0
        apex_config:
          title:
            text: W
      - id: el
        opposite: true
        decimals: 0
        min: -20
        max: 90
        apex_config:
          title:
            text: sun °
    series:
      - entity: sensor.goodwe_pv_power
        name: PV
        yaxis_id: pw
        type: area
        color: '#f0c064'
        float_precision: 0
        group_by:
          func: avg
          duration: 5min
      - entity: sensor.sun_elevation
        name: Sun elevation
        yaxis_id: el
        type: line
        color: '#7fb8ff'
        float_precision: 1
        group_by:
          func: avg
          duration: 5min
  - type: grid
    columns: 4
    square: false
    cards:
      - type: custom:mushroom-entity-card
        entity: sensor.sun_elevation
        name: Elevation
        icon: mdi:angle-acute
        icon_color: amber
      - type: custom:mushroom-entity-card
        entity: sensor.sun_azimuth
        name: Azimuth
        icon: mdi:compass-outline
        icon_color: blue
      - type: custom:mushroom-entity-card
        entity: sensor.goodwe_pv_power
        name: PV Now
        icon: mdi:solar-power
        icon_color: amber
      - type: custom:mushroom-entity-card
        entity: sensor.sun_next_setting
        name: Sunset
        icon: mdi:weather-sunset-down
icon_color: deep-orangePV STRINGS
The three strings charted together, which shows the hand-over from one roof face to the other directly. On this array the south-east face peaks about 90 minutes before solar noon and the north-west pair about two and a quarter hours after, roughly three and three-quarter hours apart.
type: custom:stack-in-card
grid_options:
  columns: 12
cards:
  - type: custom:mushroom-template-card
    primary: PV STRINGS
    icon: mdi:solar-panel-large
    icon_color: '{{ ''amber'' if (states(''sensor.goodwe_pv3_power'') | float(0) + states(''sensor.goodwe_pv4_power'') | float(0)) + states(''sensor.goodwe_pv2_power'') | float(0) > 100 else ''disabled'' }}'
    secondary: '{% set nw = (states(''sensor.goodwe_pv3_power'') | float(0) + states(''sensor.goodwe_pv4_power'') | float(0)) %}{% set se = states(''sensor.goodwe_pv2_power'') | float(0) %}NW {{ (nw/1000) | round(2) }} kW · SE {{ (se/1000) | round(2) }} kW{% if nw + se > 100 %} · SE is {{ (se / (nw + se) * 100) | round }}% of output{% endif %} — two faces, peaking ~3¾ h apart'
    multiline_secondary: true
  - type: custom:apexcharts-card
    header:
      show: true
      title: Strings through the day - 24 h
      show_states: false
    graph_span: 24h
    update_interval: 2min
    apex_config:
      chart:
        height: 230
        stacked: false
      stroke:
        width: 2
        curve: smooth
      dataLabels:
        enabled: false
      legend:
        show: true
        position: bottom
      xaxis:
        labels:
          datetimeUTC: false
      tooltip:
        x:
          format: ddd HH:mm
    yaxis:
      - decimals: 0
        min: 0
        apex_config:
          title:
            text: W
    series:
      - entity: sensor.goodwe_pv3_power
        name: PV3 north-west
        color: '#f0c064'
        type: area
        group_by:
          func: avg
          duration: 5min
      - entity: sensor.goodwe_pv4_power
        name: PV4 north-west
        color: '#e08a3c'
        type: area
        group_by:
          func: avg
          duration: 5min
      - entity: sensor.goodwe_pv2_power
        name: PV2 south-east
        color: '#7fb8ff'
        type: area
        group_by:
          func: avg
          duration: 5min
  - type: grid
    columns: 3
    square: false
    cards:
      - type: custom:mushroom-entity-card
        entity: sensor.goodwe_pv3_power
        name: PV3 · NW
        icon: mdi:solar-panel
        icon_color: amber
      - type: custom:mushroom-entity-card
        entity: sensor.goodwe_pv4_power
        name: PV4 · NW
        icon: mdi:solar-panel
        icon_color: amber
      - type: custom:mushroom-entity-card
        entity: sensor.goodwe_pv2_power
        name: PV2 · SE
        icon: mdi:solar-panel
        icon_color: blue
  - type: grid
    columns: 3
    square: false
    cards:
      - type: custom:mushroom-entity-card
        entity: sensor.goodwe_pv3_voltage
        name: PV3 V
        icon: mdi:flash
      - type: custom:mushroom-entity-card
        entity: sensor.goodwe_pv4_voltage
        name: PV4 V
        icon: mdi:flash
      - type: custom:mushroom-entity-card
        entity: sensor.goodwe_pv2_voltage
        name: PV2 V
        icon: mdi:flash
  - type: markdown
content: '**PV1 is not connected** — the inverter has four string inputs and three are used. PV3 and PV4 share the north-west face and carry ~85% of output; PV2 is the south-east face and leads only before about 08:00.'CLEAR-SKY PERFORMANCE
Daily generation as columns against the modelled ceiling as a line, plus capture, shortfall, tomorrow’s forecast and the editable performance ratio. The ceiling comes from section 2.6.
type: custom:stack-in-card
cards:
  - type: custom:mushroom-template-card
    primary: CLEAR-SKY PERFORMANCE
    secondary: '{{ states(''sensor.goodwe_today_s_pv_generation'') }} of {{ states(''sensor.solar_clear_sky_today'') }} kWh possible — {{ states(''sensor.solar_capture_today'') }}% captured, {{ states(''sensor.solar_shortfall_today'') }} kWh lost to cloud'
    icon: mdi:weather-sunny-alert
    icon_color: amber
  - type: custom:apexcharts-card
    graph_span: 14d
    span:
      end: day
    header:
      show: true
      title: Daily generation vs clear-sky ceiling
      show_states: false
    apex_config:
      chart:
        height: 250
      legend:
        show: true
      plotOptions:
        bar:
          columnWidth: 60%
      grid:
        borderColor: '#8883'
    series:
      - entity: sensor.goodwe_total_pv_generation
        name: Generated
        color: '#e8930c'
        type: column
        statistics:
          type: change
          period: day
      - entity: sensor.solar_clear_sky_today
        name: Clear-sky ceiling
        color: '#9aa0a6'
        type: line
        stroke_width: 2
        group_by:
          func: max
          duration: 1d
    grid_options:
      columns: 12
  - type: grid
    columns: 2
    square: false
    cards:
      - type: custom:mushroom-entity-card
        entity: sensor.solar_capture_today
        name: Captured
        icon: mdi:percent
        icon_color: amber
      - type: custom:mushroom-entity-card
        entity: sensor.solar_shortfall_today
        name: Lost to cloud
        icon: mdi:weather-cloudy
        icon_color: grey
      - type: custom:mushroom-entity-card
        entity: sensor.solar_forecast_tomorrow
        name: Forecast tomorrow
        icon: mdi:weather-partly-cloudy
        icon_color: blue
      - type: custom:mushroom-entity-card
        entity: input_number.solar_performance_ratio
        name: Perf. ratio
        icon: mdi:chart-bell-curve
        icon_color: purple
grid_options:
columns: 12Column 3: where the energy went
POWER RIGHT NOW (sankey)
The live counterpart to the daily sankey, and the one that does need the one-directional split sensors, since a sankey takes no negatives.
type: custom:sankey-chart
title: Power right now
unit: W
unit_prefix: ''
round: 0
height: 230
show_names: true
show_icons: false
min_box_height: 3
grid_options:
  columns: 12
sections:
  - entities:
      - entity_id: sensor.goodwe_pv_power_total
        name: Solar
        color: '#ff9800'
        children:
          - sensor.goodwe_house_consumption
          - sensor.goodwe_battery_charge_power
          - sensor.goodwe_grid_export_power
      - entity_id: sensor.goodwe_grid_import_power
        name: Grid in
        color: '#2196f3'
        children:
          - sensor.goodwe_house_consumption
      - entity_id: sensor.goodwe_battery_discharge_power
        name: Battery out
        color: '#4caf50'
        children:
          - sensor.goodwe_house_consumption
  - entities:
      - entity_id: sensor.goodwe_house_consumption
        name: House
        color: '#00bcd4'
      - entity_id: sensor.goodwe_battery_charge_power
        name: Battery in
        color: '#4caf50'
      - entity_id: sensor.goodwe_grid_export_power
        name: Grid out
color: '#9c27b0'SOURCES OF ENERGY TODAY
A donut of solar / grid / battery against the house total. Check your inverter’s own “solar to load” figure before charting it beside battery discharge. On a second system that field turned out to include solar that reached the load via the battery, so plotting the two together double-counted the battery throughput every day.
type: custom:stack-in-card
cards:
  - type: custom:mushroom-template-card
    primary: SOURCES OF ENERGY TODAY
    secondary: House {{ states('sensor.goodwe_today_load') }} kWh | net cost ${{ states('sensor.electricity_net_today') }}
    icon: mdi:chart-donut
    icon_color: blue
  - type: custom:apexcharts-card
    chart_type: donut
    header:
      show: true
      title: Where today's energy came from
    apex_config:
      chart:
        height: 260
      legend:
        position: bottom
    series:
      - entity: sensor.goodwe_today_s_pv_generation
        name: Solar
        color: '#facc15'
      - entity: sensor.grid_import_daily
        name: Grid in
        color: '#f87171'
      - entity: sensor.battery_discharged_daily
        name: Battery out
        color: '#fb923c'
  - type: grid
    columns: 2
    square: false
    cards:
      - type: custom:mushroom-entity-card
        entity: sensor.electricity_net_today
        name: Cost today
        icon: mdi:cash-minus
        icon_color: red
      - type: custom:mushroom-entity-card
        entity: sensor.electricity_savings_today
        name: Saved today
        icon: mdi:cash-plus
        icon_color: green
      - type: custom:mushroom-entity-card
        entity: sensor.grid_import_daily
        name: Grid in
        icon: mdi:transmission-tower-import
        icon_color: red
      - type: custom:mushroom-entity-card
        entity: sensor.grid_export_daily
        name: Grid out
        icon: mdi:transmission-tower-export
        icon_color: green
grid_options:
columns: 12POWER: 48 HOURS
Generation, load and grid over two days, which is the window where daily rhythm becomes visible without the chart turning to mush.
type: custom:stack-in-card
cards:
  - type: custom:mushroom-template-card
    primary: POWER — 48 HOURS
    secondary: Solar {{ states('sensor.goodwe_pv_power_total') }} W | house {{ states('sensor.goodwe_house_consumption') }} W | battery {{ states('sensor.goodwe_battery_state_of_charge') }}%
    icon: mdi:chart-areaspline
    icon_color: cyan
  - type: custom:apexcharts-card
    graph_span: 48h
    header:
      show: true
      title: Solar · house · battery
      show_states: true
      colorize_states: true
    apex_config:
      chart:
        height: 270
      legend:
        show: true
      stroke:
        width: 2
      grid:
        borderColor: '#8883'
    yaxis:
      - id: w
        decimals: 0
        apex_config:
          title:
            text: W
      - id: pct
        opposite: true
        min: 0
        max: 100
        decimals: 0
        apex_config:
          title:
            text: '%'
    series:
      - entity: sensor.goodwe_pv_power
        name: Solar
        type: area
        opacity: 0.22
        color: '#e8930c'
        yaxis_id: w
        group_by:
          func: avg
          duration: 10min
      - entity: sensor.goodwe_house_consumption
        name: House
        type: line
        color: '#2f7fd1'
        yaxis_id: w
        group_by:
          func: avg
          duration: 10min
      - entity: sensor.goodwe_battery_state_of_charge
        name: Battery %
        type: line
        color: '#2e9e5b'
        yaxis_id: pct
        group_by:
          func: avg
          duration: 10min
    grid_options:
      columns: 12
grid_options:
columns: 12Column 4: battery detail and settings
ENERGY STORAGE & THERMALS
Stored and usable energy, plus pack temperatures.
type: custom:stack-in-card
cards:
  - type: custom:mushroom-template-card
    primary: ENERGY STORAGE & THERMALS
    secondary: Battery {{ states('sensor.goodwe_battery_temperature') }}°C | stored {{ states('sensor.goodwe_battery_stored_energy') }} kWh | runs out {{ as_timestamp(states('sensor.goodwe_battery_runs_out'), 0) | timestamp_custom('%-I:%M %p', true, 'unknown') }}
    icon: mdi:battery-high
    icon_color: green
  - type: custom:apexcharts-card
    header:
      show: true
      title: Battery power balance
    graph_span: 12h
    apex_config:
      chart:
        height: 230
      stroke:
        width: 2
        curve: smooth
      dataLabels:
        enabled: false
      legend:
        show: true
        position: bottom
      xaxis:
        labels:
          datetimeUTC: false
    series:
      - entity: sensor.goodwe_battery_charge_power
        name: Charging (+)
        color: '#22c55e'
        type: area
        group_by:
          func: avg
          duration: 5min
      - entity: sensor.goodwe_battery_discharge_power
        name: Discharging (?)
        color: '#ef4444'
        type: area
        group_by:
          func: avg
          duration: 5min
        invert: true
  - type: grid
    columns: 2
    square: false
    cards:
      - type: custom:mushroom-entity-card
        entity: sensor.goodwe_battery_state_of_charge
        name: SoC
        icon: mdi:battery-high
        icon_color: green
      - type: custom:mushroom-entity-card
        entity: sensor.goodwe_battery_temperature
        name: Battery temp
        icon: mdi:thermometer
        icon_color: orange
      - type: custom:mushroom-entity-card
        entity: sensor.battery_charged_daily
        name: Charged today
        icon: mdi:battery-plus
        icon_color: green
      - type: custom:mushroom-entity-card
        entity: sensor.battery_discharged_daily
        name: Discharged today
        icon: mdi:battery-minus
        icon_color: red
grid_options:
columns: 12BATTERY PERFORMANCE
Charge and discharge energy over a selectable period. The period selector is a mushroom-select-card driving an input_select, which the chart reads.
type: custom:stack-in-card
cards:
  - type: custom:mushroom-template-card
    primary: BATTERY PERFORMANCE
    secondary: Health {{ states('sensor.goodwe_battery_state_of_health') }}% | usable {{ states('sensor.goodwe_battery_usable_energy') }} kWh of {{ states('input_number.goodwe_battery_capacity') }} kWh
    icon: mdi:battery-charging-high
    icon_color: teal
  - type: custom:apexcharts-card
    header:
      show: true
      title: Battery temperature
    graph_span: 24h
    apex_config:
      chart:
        height: 210
      stroke:
        width: 2
        curve: smooth
      dataLabels:
        enabled: false
      legend:
        show: false
        position: bottom
      xaxis:
        labels:
          datetimeUTC: false
    series:
      - entity: sensor.goodwe_battery_temperature
        name: Temp
        color: '#fb923c'
        type: line
        group_by:
          func: avg
          duration: 10min
  - type: grid
    columns: 3
    square: false
    cards:
      - type: custom:mushroom-entity-card
        entity: sensor.goodwe_battery_power
        name: Battery power
        icon: mdi:battery-sync
        icon_color: cyan
      - type: custom:mushroom-entity-card
        entity: sensor.goodwe_battery_state_of_health
        name: Health
        icon: mdi:heart-pulse
        icon_color: green
      - type: custom:mushroom-entity-card
        entity: number.goodwe_depth_of_discharge_on_grid
        name: DoD floor
        icon: mdi:battery-low
        icon_color: orange
  - type: custom:mushroom-select-card
    entity: select.goodwe_inverter_operation_mode
    name: Operating mode
    icon_color: blue
  - type: grid
    columns: 2
    square: false
    cards:
      - type: custom:mushroom-entity-card
        entity: sensor.goodwe_battery_voltage
        name: DC volts
        icon: mdi:flash-triangle
        icon_color: cyan
      - type: custom:mushroom-entity-card
        entity: sensor.goodwe_battery_current
        name: DC amps
        icon: mdi:current-dc
        icon_color: cyan
grid_options:
columns: 12SETTINGS & TARIFF
The editable input_number helpers that drive every cost figure on the page. These use custom:mushroom-number-card, which is the card that solves the usual bind: a native entities row is editable but visually alien among the panels, while a mushroom-entity-card matches the style and is read-only. The number card does both.
Caveat: three tariff fields use step: 0.0001, so the +/? buttons are useless on them. Tap the card and type the value in the more-info dialog instead, which is the right workflow anyway, since these are set once off a bill and then left alone.
type: custom:stack-in-card
cards:
  - type: custom:mushroom-template-card
    primary: SETTINGS & TARIFF
    secondary: Import ${{ states('input_number.electricity_import_rate') }}/kWh · feed-in ${{ states('input_number.electricity_feed_in_tariff') }} · supply ${{ states('input_number.electricity_daily_supply_charge') }}/day
    icon: mdi:tune
    icon_color: grey
  - type: grid
    columns: 2
    square: false
    cards:
      - type: custom:mushroom-number-card
        entity: input_number.electricity_import_rate
        name: Import rate
        icon: mdi:cash-minus
        icon_color: red
        display_mode: buttons
      - type: custom:mushroom-number-card
        entity: input_number.electricity_feed_in_tariff
        name: Feed-in
        icon: mdi:cash-plus
        icon_color: green
        display_mode: buttons
      - type: custom:mushroom-number-card
        entity: input_number.electricity_daily_supply_charge
        name: Daily supply
        icon: mdi:calendar-today
        icon_color: orange
        display_mode: buttons
      - type: custom:mushroom-number-card
        entity: input_number.electricity_gst_rate
        name: GST
        icon: mdi:percent
        icon_color: grey
        display_mode: buttons
  - type: grid
    columns: 2
    square: false
    cards:
      - type: custom:mushroom-number-card
        entity: number.goodwe_grid_export_limit
        name: Export limit
        icon: mdi:transmission-tower-export
        icon_color: purple
        display_mode: buttons
      - type: custom:mushroom-number-card
        entity: input_number.goodwe_battery_capacity
        name: Battery kWh
        icon: mdi:battery-high
        icon_color: teal
        display_mode: buttons
      - type: custom:mushroom-number-card
        entity: input_number.solar_array_size
        name: Array size
        icon: mdi:solar-panel
        icon_color: amber
        display_mode: buttons
      - type: custom:mushroom-number-card
        entity: input_number.solar_performance_ratio
        name: Perf ratio
        icon: mdi:chart-bell-curve
        icon_color: blue
        display_mode: buttons
grid_options:
columns: 12Column 5: inverter and grid
AC & INVERTER
Inverter modes, AC voltages and frequency.
type: custom:stack-in-card
cards:
  - type: custom:mushroom-template-card
    primary: AC & INVERTER
    secondary: '{{ states(''sensor.goodwe_on_grid_l1_voltage'') }} V | {{ states(''sensor.goodwe_on_grid_l1_frequency'') }} Hz | radiator {{ states(''sensor.goodwe_inverter_temperature_radiator'') }}°C'
    icon: mdi:flash
    icon_color: yellow
  - type: grid
    columns: 3
    square: false
    cards:
      - type: custom:mushroom-entity-card
        entity: sensor.goodwe_on_grid_l1_voltage
        name: Voltage
        icon: mdi:sine-wave
        icon_color: red
      - type: custom:mushroom-entity-card
        entity: sensor.goodwe_on_grid_l1_frequency
        name: Frequency
        icon: mdi:sine-wave
        icon_color: green
      - type: custom:mushroom-entity-card
        entity: sensor.goodwe_inverter_temperature_radiator
        name: Radiator
        icon: mdi:thermometer
        icon_color: orange
  - type: custom:apexcharts-card
    header:
      show: true
      title: Grid voltage
    graph_span: 3h
    apex_config:
      chart:
        height: 200
      stroke:
        width: 2
        curve: smooth
      dataLabels:
        enabled: false
      legend:
        show: false
        position: bottom
      xaxis:
        labels:
          datetimeUTC: false
      yaxis:
        min: 225
        max: 260
    series:
      - entity: sensor.goodwe_on_grid_l1_voltage
        name: Voltage
        color: '#ef4444'
        type: line
        group_by:
          func: avg
          duration: 1min
    update_interval: 30s
  - type: grid
    columns: 3
    square: false
    cards:
      - type: custom:mushroom-entity-card
        entity: sensor.goodwe_work_mode
        name: Work mode
        icon: mdi:state-machine
        icon_color: blue
      - type: custom:mushroom-entity-card
        entity: sensor.goodwe_grid_mode
        name: Grid mode
        icon: mdi:transmission-tower
        icon_color: green
      - type: custom:mushroom-entity-card
        entity: sensor.goodwe_battery_mode
        name: Batt mode
        icon: mdi:battery-sync
        icon_color: orange
grid_options:
columns: 12GRID & ENERGY FLOW
Import and export, today and lifetime, from the meter registers rather than integrated power. See the note on registers in the traps section.
type: custom:stack-in-card
cards:
  - type: custom:mushroom-template-card
    primary: GRID & ENERGY FLOW
    secondary: Imported {{ states('sensor.goodwe_meter_total_energy_import') }} kWh | exported {{ states('sensor.goodwe_meter_total_energy_export') }} kWh lifetime
    icon: mdi:transmission-tower-export
    icon_color: red
  - type: custom:apexcharts-card
    header:
      show: true
      title: Grid power (+ export / ? import)
    graph_span: 6h
    apex_config:
      chart:
        height: 210
      stroke:
        width: 2
        curve: smooth
      dataLabels:
        enabled: false
      legend:
        show: false
        position: bottom
      xaxis:
        labels:
          datetimeUTC: false
    series:
      - entity: sensor.goodwe_active_power
        name: Grid
        color: '#3b82f6'
        type: area
        group_by:
          func: avg
          duration: 1min
    update_interval: 30s
  - type: grid
    columns: 2
    square: false
    cards:
      - type: custom:mushroom-entity-card
        entity: sensor.grid_import_daily
        name: Grid today
        icon: mdi:download-network
        icon_color: red
      - type: custom:mushroom-entity-card
        entity: sensor.grid_export_daily
        name: Export today
        icon: mdi:upload-network
        icon_color: green
      - type: custom:mushroom-entity-card
        entity: sensor.goodwe_meter_total_energy_import
        name: Grid total
        icon: mdi:transmission-tower
        icon_color: red
      - type: custom:mushroom-entity-card
        entity: sensor.goodwe_meter_total_energy_export
        name: Export total
        icon: mdi:transmission-tower-export
        icon_color: green
grid_options:
columns: 12Column 6: money
COST & BILLING
Three worked-example markdown tables (today, month to date, and bill to date), each showing usage, supply, tax and credit as separate lines. When a figure looks wrong you can see which term is wrong, instead of staring at a single total.
type: custom:stack-in-card
cards:
  - type: custom:mushroom-template-card
    primary: COST & BILLING
    secondary: Today ${{ states('sensor.electricity_net_today') }} | month ${{ states('sensor.electricity_net_month') }} | projected ${{ states('sensor.electricity_bill_projected') }}
    icon: mdi:cash-multiple
    icon_color: red
  - type: grid
    columns: 2
    square: false
    cards:
      - type: custom:mushroom-entity-card
        entity: sensor.electricity_net_today
        name: Net today
        icon: mdi:cash-minus
        icon_color: red
      - type: custom:mushroom-entity-card
        entity: sensor.electricity_savings_today
        name: Saved today
        icon: mdi:piggy-bank
        icon_color: green
      - type: custom:mushroom-entity-card
        entity: sensor.electricity_net_month
        name: This month
        icon: mdi:calendar-month
        icon_color: orange
      - type: custom:mushroom-entity-card
        entity: sensor.electricity_bill_projected
        name: Projected bill
        icon: mdi:file-document
        icon_color: blue
  - type: grid
    columns: 2
    square: false
    cards:
      - type: custom:mushroom-entity-card
        entity: sensor.electricity_bill_to_date
        name: Bill to date
        icon: mdi:receipt
        icon_color: orange
      - type: custom:mushroom-entity-card
        entity: sensor.electricity_billing_period
        name: Period
        icon: mdi:calendar-range
        icon_color: grey
      - type: custom:mushroom-entity-card
        entity: sensor.grid_import_billing
        name: Imported
        icon: mdi:transmission-tower-import
        icon_color: red
      - type: custom:mushroom-entity-card
        entity: sensor.grid_export_billing
        name: Exported
        icon: mdi:transmission-tower-export
        icon_color: green
  - type: markdown
    content: |
      {%- set rate = states('input_number.electricity_import_rate') | float(0) -%}
      {%- set fit  = states('input_number.electricity_feed_in_tariff') | float(0) -%}
      {%- set sup  = states('input_number.electricity_daily_supply_charge') | float(0) -%}
      {%- set gstp = states('input_number.electricity_gst_rate') | float(0) -%}
      {%- set imp = states('sensor.grid_import_daily') | float(0) -%}
      {%- set exp = states('sensor.grid_export_daily') | float(0) -%}
      {%- set load = states('sensor.goodwe_today_load') | float(0) -%}
      {%- set ch = imp*rate + sup -%}{%- set gst = ch*gstp/100 -%}{%- set cr = exp*fit -%}
      #### Today

      | Item | Working | Amount |
      |:---|:---|---:|
      | Usage | {{ '%.2f'|format(imp) }} kWh × ${{ '%.4f'|format(rate) }} | ${{ '%.2f'|format(imp*rate) }} |
      | Supply charge | 1 day × ${{ '%.4f'|format(sup) }} | ${{ '%.2f'|format(sup) }} |
      | GST | {{ '%.0f'|format(gstp) }}% of ${{ '%.2f'|format(ch) }} | ${{ '%.2f'|format(gst) }} |
      | Feed-in credit | {{ '%.2f'|format(exp) }} kWh × ${{ '%.4f'|format(fit) }} | ?${{ '%.2f'|format(cr) }} |
      | **Net today** | | **${{ '%.2f'|format(ch+gst-cr) }}** |

      Grid-only cost for the same {{ '%.1f'|format(load) }} kWh would be **${{ '%.2f'|format((load*rate+sup)*(1+gstp/100)) }}** — you are **${{ '%.2f'|format((load*rate+sup)*(1+gstp/100) - (ch+gst-cr)) }}** ahead.
    grid_options:
      columns: 12
  - type: markdown
    content: |
      {%- set rate = states('input_number.electricity_import_rate') | float(0) -%}
      {%- set fit  = states('input_number.electricity_feed_in_tariff') | float(0) -%}
      {%- set sup  = states('input_number.electricity_daily_supply_charge') | float(0) -%}
      {%- set gstp = states('input_number.electricity_gst_rate') | float(0) -%}
      {%- set imp = states('sensor.grid_import_monthly') | float(0) -%}
      {%- set exp = states('sensor.grid_export_monthly') | float(0) -%}
      {%- set days = now().day -%}
      {%- set ch = imp*rate + sup*days -%}{%- set gst = ch*gstp/100 -%}{%- set cr = exp*fit -%}
      #### Month to date

      | Item | Working | Amount |
      |:---|:---|---:|
      | Usage | {{ '%.2f'|format(imp) }} kWh × ${{ '%.4f'|format(rate) }} | ${{ '%.2f'|format(imp*rate) }} |
      | Supply charge | {{ days }} days × ${{ '%.4f'|format(sup) }} | ${{ '%.2f'|format(sup*days) }} |
      | GST | {{ '%.0f'|format(gstp) }}% of ${{ '%.2f'|format(ch) }} | ${{ '%.2f'|format(gst) }} |
      | Feed-in credit | {{ '%.2f'|format(exp) }} kWh × ${{ '%.4f'|format(fit) }} | ?${{ '%.2f'|format(cr) }} |
      | **Net this month** | | **${{ '%.2f'|format(ch+gst-cr) }}** |
    grid_options:
      columns: 12
  - type: markdown
    content: |-
      {%- set rate = states('input_number.electricity_import_rate') | float(0) -%}
      {%- set fit  = states('input_number.electricity_feed_in_tariff') | float(0) -%}
      {%- set sup  = states('input_number.electricity_daily_supply_charge') | float(0) -%}
      {%- set gstp = states('input_number.electricity_gst_rate') | float(0) -%}
      {%- set imp = states('sensor.grid_import_billing') | float(0) -%}
      {%- set exp = states('sensor.grid_export_billing') | float(0) -%}
      {%- set days = state_attr('sensor.electricity_billing_period','days_elapsed') | int(1) -%}
      {%- set total = state_attr('sensor.electricity_billing_period','days_total') | int(30) -%}
      {%- set left = state_attr('sensor.electricity_billing_period','days_left') | int(0) -%}
      {%- set ch = imp*rate + sup*days -%}{%- set gst = ch*gstp/100 -%}{%- set cr = exp*fit -%}
      #### Bill to date — {{ states('sensor.electricity_billing_period') }}

      | Item | Working | Amount |
      |:---|:---|---:|
      | Usage | {{ '%.2f'|format(imp) }} kWh × ${{ '%.4f'|format(rate) }} | ${{ '%.2f'|format(imp*rate) }} |
      | Supply charge | {{ days }} day{{ 's' if days != 1 }} × ${{ '%.4f'|format(sup) }} | ${{ '%.2f'|format(sup*days) }} |
      | GST | {{ '%.0f'|format(gstp) }}% of ${{ '%.2f'|format(ch) }} | ${{ '%.2f'|format(gst) }} |
      | Feed-in credit | {{ '%.2f'|format(exp) }} kWh × ${{ '%.4f'|format(fit) }} | ?${{ '%.2f'|format(cr) }} |
      | **Bill to date** | | **${{ '%.2f'|format(ch+gst-cr) }}** |

      *This is the one that matches an invoice: the billing period runs the 11th to the 10th — {{ days }} of {{ total }} days in, {{ left }} to go. **Month to date above is the CALENDAR month** (from the 1st), so the two do not agree: ${{ '%.2f'|format(states('sensor.electricity_net_month') | float(0)) }} there against **${{ '%.2f'|format(ch+gst-cr) }}** here.*
grid_options:
columns: 12PAYBACK
Progress as a templated block bar, not a gauge. At 0.6% repaid the gauge’s severity bands painted it bright red, which reads as a fault when being 0.6% through a multi-year payback twelve days after commissioning is exactly right. A dial conveys nothing at that scale either: the needle is pinned to the stop for months.
General rule: severity colours belong on health metrics, not progress metrics. Low battery is a problem; low payback-so-far is just early.
The fill uses round(0, 'ceil') so any non-zero progress shows at least one block rather than an empty bar, and is clamped with | min so it cannot overflow past 100%.
type: custom:stack-in-card
cards:
  - type: custom:mushroom-template-card
    primary: PAYBACK
    secondary: ${{ states('sensor.solar_lifetime_savings') }} returned of ${{ states('input_number.solar_system_cost') | int }} — {{ states('sensor.solar_payback_progress') }}%
    icon: mdi:cash-clock
    icon_color: green
  - type: markdown
    grid_options:
      columns: 12
    content: |-
      {%- set p = states('sensor.solar_payback_progress') | float(0) -%}
      {%- set saved = states('sensor.solar_lifetime_savings') | float(0) -%}
      {%- set cost = states('input_number.solar_system_cost') | float(1) -%}
      {%- set eta = states('sensor.solar_payback_eta') -%}
      {%- set n = 28 -%}{%- set fill = [(p / 100 * n) | round(0, 'ceil') | int, n] | min -%}
      {{ '?' * fill }}{{ '?' * (n - fill) }}

      **{{ '%.2f'|format(p) }}%** — ${{ '{:,.0f}'.format(saved) }} of ${{ '{:,.0f}'.format(cost) }} recovered.

      Break-even {{ as_timestamp(eta) | timestamp_custom('%b %Y') if eta not in ['unknown','unavailable'] else 'unknown' }}.
  - type: markdown
    content: |-
      {%- set cost = states('input_number.solar_system_cost') | float(0) -%}
      {%- set save = states('sensor.solar_lifetime_savings') | float(0) -%}
      {%- set left = states('sensor.solar_payback_remaining') | float(0) -%}
      {%- set days = state_attr('sensor.solar_payback_eta','days_running') | int(1) -%}
      {%- set avg  = state_attr('sensor.solar_payback_eta','avg_per_day') | float(0) -%}
      {%- set yrs  = state_attr('sensor.solar_payback_eta','years_remaining') -%}
      {%- set load = states('sensor.goodwe_total_load') | float(0) -%}
      {%- set imp  = states('sensor.goodwe_meter_total_energy_import') | float(0) -%}
      {%- set exp  = states('sensor.goodwe_meter_total_energy_export') | float(0) -%}
      {%- set rate = states('input_number.electricity_import_rate') | float(0) -%}
      {%- set fit  = states('input_number.electricity_feed_in_tariff') | float(0) -%}
      {%- set g    = 1 + states('input_number.electricity_gst_rate') | float(0) / 100 -%}
      #### How the return is calculated

      | Item | Working | Amount |
      |:---|:---|---:|
      | Grid-only cost | {{ '%.1f'|format(load) }} kWh × ${{ '%.4f'|format(rate) }} +GST | ${{ '%.2f'|format(load*rate*g) }} |
      | Less: imported | {{ '%.1f'|format(imp) }} kWh × ${{ '%.4f'|format(rate) }} +GST | ?${{ '%.2f'|format(imp*rate*g) }} |
      | Plus: exported | {{ '%.1f'|format(exp) }} kWh × ${{ '%.4f'|format(fit) }} | +${{ '%.2f'|format(exp*fit) }} |
      | **Returned so far** | over {{ days }} day{{ 's' if days != 1 }} | **${{ '%.2f'|format(save) }}** |
      | **Still to recover** | of ${{ '{:,.0f}'.format(cost) }} | **${{ '{:,.2f}'.format(left) }}** |

      At the current average of **${{ '%.2f'|format(avg) }}/day** that is **{{ yrs }} years** to break even.

      *Supply charge excluded — payable either way. Straight-line from {{ days }} day{{ 's' if days != 1 }} of data; a placeholder until there is a full year of seasons.*
    grid_options:
      columns: 12
  - type: grid
    columns: 2
    square: false
    cards:
      - type: custom:mushroom-entity-card
        entity: sensor.solar_payback_remaining
        name: Remaining
        icon: mdi:cash-remove
        icon_color: orange
      - type: custom:mushroom-entity-card
        entity: sensor.solar_payback_eta
        name: Break-even
        icon: mdi:calendar-clock
        icon_color: blue
      - type: custom:mushroom-entity-card
        entity: input_number.solar_system_cost
        name: System cost
        icon: mdi:currency-usd
        icon_color: grey
      - type: custom:mushroom-entity-card
        entity: input_datetime.solar_install_date
        name: Installed
        icon: mdi:calendar-check
        icon_color: grey
  - type: markdown
    content: |-
      {%- set rate = states('input_number.electricity_import_rate') | float(0) -%}
      {%- set fit  = states('input_number.electricity_feed_in_tariff') | float(0) -%}
      {%- set sup  = states('input_number.electricity_daily_supply_charge') | float(0) -%}
      {%- set gstp = states('input_number.electricity_gst_rate') | float(0) -%}
      {%- set el   = state_attr('sensor.electricity_billing_period','days_elapsed') | int(1) -%}
      {%- set tot  = state_attr('sensor.electricity_billing_period','days_total') | int(30) -%}
      {%- set imp  = states('sensor.grid_import_billing') | float(0) -%}
      {%- set exp  = states('sensor.grid_export_billing') | float(0) -%}
      {%- set pimp = imp / el * tot -%}{%- set pexp = exp / el * tot -%}
      {%- set ch = pimp*rate + sup*tot -%}{%- set gst = ch*gstp/100 -%}{%- set cr = pexp*fit -%}
      #### Projected bill — {{ states('sensor.electricity_billing_period') }}

      | Item | Working | Amount |
      |:---|:---|---:|
      | Usage | {{ '%.1f'|format(pimp) }} kWh × ${{ '%.4f'|format(rate) }} | ${{ '%.2f'|format(pimp*rate) }} |
      | Supply charge | {{ tot }} days × ${{ '%.4f'|format(sup) }} | ${{ '%.2f'|format(sup*tot) }} |
      | GST | {{ '%.0f'|format(gstp) }}% of ${{ '%.2f'|format(ch) }} | ${{ '%.2f'|format(gst) }} |
      | Feed-in credit | {{ '%.1f'|format(pexp) }} kWh × ${{ '%.4f'|format(fit) }} | ?${{ '%.2f'|format(cr) }} |
      | **Projected total** | | **${{ '%.2f'|format(ch+gst-cr) }}** |

      *Projected from {{ el }} of {{ tot }} days.{% if el < 7 %} **Too early to trust** — {{ el }} day{{ 's' if el != 1 }} is too few for a straight line; one sunny or cloudy day moves it by tens of dollars.{% else %} Straight-line, so a run of cloudy days late in the period will still move it.{% endif %}*
    grid_options:
      columns: 12
grid_options:
columns: 12Column 7: the native energy cards
The four built-in energy-* cards cannot be restyled internally, since they take their period from their own date selector. Wrapping each in a stack-in-card under a mushroom header makes them read as part of the dashboard rather than a foreign strip. energy-date-selection is view-wide, so it appears once at the top of the first of them and governs all four.
type: custom:stack-in-card
cards:
  - type: custom:mushroom-template-card
    primary: ENERGY HISTORY
    secondary: Pick a period — the panels below follow it
    icon: mdi:calendar-clock
    icon_color: blue
  - type: energy-date-selection
    grid_options:
      columns: 12
  - type: energy-distribution
    link_dashboard: true
    grid_options:
      columns: 12
grid_options:
  columns: 12

type: custom:stack-in-card
cards:
  - type: custom:mushroom-template-card
    primary: HISTORY — SOURCES
    secondary: Where the energy came from, and what it cost
    icon: mdi:table
    icon_color: cyan
  - type: energy-sources-table
    grid_options:
      columns: 12
grid_options:
  columns: 12

type: custom:stack-in-card
cards:
  - type: custom:mushroom-template-card
    primary: HISTORY — USAGE
    secondary: Grid, solar and battery by hour
    icon: mdi:chart-bar
    icon_color: purple
  - type: energy-usage-graph
    grid_options:
      columns: 12
grid_options:
  columns: 12

type: custom:stack-in-card
cards:
  - type: custom:mushroom-template-card
    primary: HISTORY — SOLAR
    secondary: Production against the forecast
    icon: mdi:solar-power
    icon_color: yellow
  - type: energy-solar-graph
    grid_options:
      columns: 12
grid_options:
columns: 126. Automations this data makes possible
The sensors in section 2 are worth building for the dashboard alone, but they also unlock automations that the raw inverter entities cannot support. A signed power value cannot be threshold-triggered sensibly, and “battery percent” says nothing about whether the battery will last the night. These are the ones that have earned their place.
6.1 Run a load on real surplus
The obvious version of this triggers on export above some threshold. The obvious version is also wrong, because early in the day that surplus should be going into the battery. Gate it on the battery being nearly full, and the automation only fires on surplus that would otherwise be sold at the feed-in rate:
- alias: Solar surplus - start the dishwasher
  trigger:
    - platform: numeric_state
      entity_id: sensor.goodwe_grid_export_power
      above: 1500
      for: "00:10:00"          # ride out cloud flicker
  condition:
    - condition: numeric_state
      entity_id: sensor.goodwe_battery_state_of_charge
      above: 90                # do not steal from the battery
    - condition: state
      entity_id: switch.dishwasher
      state: "off"
  action:
    - service: switch.turn_on
      target:
        entity_id: switch.dishwasher
  mode: single
The for: matters. Without it a passing cloud toggles the trigger repeatedly, and an appliance that restarts mid-cycle is worse than one that never started. This is only possible because grid_export_power is one-directional: you cannot put a sensible above: on a signed sensor that swings through zero.
6.2 Warn when the battery will not reach sunrise
State of charge alone cannot answer this. 40% is comfortable in April and nowhere near enough in June. The runtime sensor from section 2.4 compares the projected empty time against the actual next sunrise:
- alias: Battery will not last until sunrise
  trigger:
    - platform: time_pattern
      minutes: "/15"
  condition:
    - condition: sun
      after: sunset
    - condition: template
      value_template: >-
        {% set out = states('sensor.goodwe_battery_runs_out') %}
        {{ out not in ['unknown', 'unavailable']
           and as_datetime(out) < as_datetime(state_attr('sun.sun', 'next_rising')) }}
    - condition: state
      entity_id: input_boolean.battery_warning_sent
      state: "off"
  action:
    - service: notify.mobile_app_phone
      data:
        message: >-
          Battery is on track to hit its floor at
          {{ as_datetime(states('sensor.goodwe_battery_runs_out')).strftime('%H:%M') }},
          before sunrise. {{ states('sensor.goodwe_battery_usable_energy') }} kWh left.
    - service: input_boolean.turn_on
      target:
        entity_id: input_boolean.battery_warning_sent
  mode: single
The input_boolean guard matters. A 15-minute trigger with no latch sends the same warning nineteen times before dawn. Clear it with a second automation at sunrise.
6.3 Detect a dead string
A failed string, a tripped isolator or a shaded panel on one MPPT is close to invisible on a daily total, because the other strings mask it. Comparing the strings against each other catches it in half an hour:
- alias: PV string produced nothing while the others did
  trigger:
    - platform: time_pattern
      minutes: "/30"
  condition:
    - condition: sun
      after: sunrise
      before: sunset
    - condition: numeric_state
      entity_id: sensor.goodwe_pv2_power
      above: 500                              # a reference string is clearly working
    - condition: template
      value_template: "{{ states('sensor.goodwe_pv3_power') | float(0) < 50 }}"
  action:
    - service: notify.mobile_app_phone
      data:
        message: >-
          PV3 is at {{ states('sensor.goodwe_pv3_power') }} W while PV2 is at
          {{ states('sensor.goodwe_pv2_power') }} W. Check the string.
  mode: single
Pick the reference string carefully on a split array. Two strings on different roof faces peak hours apart, so a comparison that is fair at noon can be badly unfair at four o’clock. Compare strings that share an orientation, or raise the threshold until the false positives stop.
6.4 Treat the inverter as a power-cut sensor
A grid-tied inverter drops off the network when the grid fails, so its availability doubles as an outage signal. It cannot distinguish a power cut from a network fault, which is why the message should not claim to:
- alias: Inverter unreachable - possible power cut
  trigger:
    - platform: state
      entity_id: sensor.goodwe_active_power
      to: unavailable
      for: "00:05:00"
  action:
    - service: notify.mobile_app_phone
      data:
        message: "Inverter unreachable for 5 minutes. Power cut, or a network fault."
  mode: single
Five minutes filters routine integration reconnects. If Home Assistant itself is on the affected supply it will be down too, so treat this as a best-effort signal rather than monitoring.
6.5 Do not mistake a BMS calibration for a fault
GoodWe packs periodically run a calibration charge, forcing the battery to 100% at a fixed rate and pulling the shortfall from the grid regardless of how much sun is available. On this system one such event imported 12.8 kWh in an afternoon. Without an explanation that looks exactly like a serious fault, so it is worth an informational notification rather than an alarm:
- alias: Battery calibration charge started
  trigger:
    - platform: state
      entity_id: sensor.goodwe_diag_status
      to: "BMS: Emergency charging"
  action:
    - service: notify.mobile_app_phone
      data:
        message: >-
          Battery calibration charge started. The inverter will force-charge to 100% and
          may import from the grid. This is normal and clears by itself.
  mode: single
Expect it on a new install. If it recurs every week, that is worth chasing, because in normal self-consumption mode nothing else should ever grid-charge the battery.
6.6 Flag a bill heading somewhere unexpected
The projected bill sensor from section 2.9 is a straight-line projection, so it is meaningless in the first few days of a period and reasonable after that:
- alias: Projected bill above budget
  trigger:
    - platform: numeric_state
      entity_id: sensor.electricity_bill_projected
      above: 120
  condition:
    - condition: template
      value_template: >-
        {{ state_attr('sensor.electricity_billing_period', 'days_elapsed') | int(0) >= 7 }}
  action:
    - service: notify.mobile_app_phone
      data:
        message: >-
          Projected bill is ${{ states('sensor.electricity_bill_projected') }} based on
          {{ state_attr('sensor.electricity_bill_projected', 'basis') }}.
  mode: single
The seven-day condition is the same guard the dashboard card uses, and for the same reason: three days of data multiplied out to a month is a number, not a projection.
What not to automate
Resist automating anything that writes inverter settings on a schedule: charge windows, discharge floors, export limits. Those interact with the inverter’s own EMS logic in ways that are hard to observe from Home Assistant, and a scheduled write that fights a manual change is very difficult to diagnose later. Read freely; write deliberately, and by hand.
7. Traps worth knowing
Prefer a real energy register over an integrated power sensor
It is easy to build kilowatt-hours with a Riemann sum over a power sensor, and sometimes you must. Where the meter exposes a real cumulative register, use the register for anything billing-relevant. Integration accrues error across polling gaps and restarts, and near zero flow it manufactures readings out of noise. Here, with export physically near zero, the integrated sensor still produced ~0.1 kWh/day of phantom export purely by integrating the meter’s tolerance band. The register correctly read nothing.
Where integration is the better option, such as a battery counter that under-reports at low power, validate it before trusting it. Sample power every 30 seconds, integrate by hand, compare against what the counter actually moved. Agreement inside a few percent is fine; a factor of two means the wrong source.
A counter that sits still is not necessarily broken
One day here imported exactly zero from the grid and the register sat unchanged from midnight to midnight, which is what a dead sensor looks like. It was not dead: independently integrating inverter power gave 0.19 kWh in, and the day really was self-sufficient with the battery carrying the night. The register’s 0.1 kWh resolution rounded it to nothing. Cross-check against an independent measurement before calling a counter stuck.
Never write a date into dashboard prose
One card carried a hand-written caveat: “Not representative, the system went in on 22 August. First meaningful projection: the period from 11 September.” True when written, false from 11 September, and it went on dismissing every projection for a reason that no longer applied. It now reads “Too early to trust” while fewer than seven days have elapsed and drops that by itself.
A related trap: a template is only as true as the entity it points at. One explainer described the method a sensor used before it was changed, and because the percentage in it was templated it rendered a live-looking figure that no longer matched what the sensor did. When a calculation changes, grep the dashboards for prose describing it.
Radial bars never render from a single state
An apexcharts radialBar for an instantaneous percentage will sit on “Loading…” forever. That chart type wants a data series; it does not draw from a current state, and it fails silently rather than erroring, so it looks like a slow load. A built-in gauge with needle: false gives the same filled arc and cannot fail that way.
The history API will quietly give you wrong answers
- It defaults
end_timeto start + one day. Ask for thirteen days and you get the first twenty-four hours with no warning, which reads as “this sensor barely reports” when you are looking at a stale slice. - A naive timestamp is parsed as local time, not UTC. Feeding it UTC output with no offset shifts the window silently. The symptom is not an error, it is plausible-looking data from the wrong period.
- It defaults to significant changes only, dropping every attribute-only change. Pass
significant_changes_only=0when analysing an attribute.
And one about windows generally: a total over a window says nothing about whether the behaviour is current. One counter showed 118,817 state changes over thirteen days, which looked like a live fault; 106,000 came from two days at the start and the rate was already forty times lower by the time anyone looked. Read the daily distribution before calling anything ongoing.
8. Validate before you save, not after
A bad entity reference renders as an “Entity not found” card and a broken template renders as nothing at all. Custom cards validate their own config and paint errors into their own body, so a broken card is invisible from the command line and absent from the log. Validate offline:
- Walk the config for every entity reference:
entity:keys,entity_idin action data, and every entity named inside a Jinja template. Check each against the states API. The template case matters: a key-only diff will happily report a sensor as dropped when it is still referenced in a header. - Render every template against
/api/templateand read the output. The rendered value is the check. A template that silently returns an empty string looks identical in the config to one that works. - Validate custom-card configs against their own schema where one ships. Several HACS cards are built with zod and export their schema in a chunk you can import under a small DOM shim, then
safeParsea candidate config offline. - Diff before saving. Re-fetch the live config, confirm it still matches what you started from, and confirm only the cards you meant to touch have changed.
That process is what caught eight cards here carrying a config option that had changed type in a card update, every one rendering a red error band that had gone unnoticed for weeks on two other dashboards. The option had become an array; the old string value still parsed as valid YAML and was rejected only by the card itself, at render time.
9. What it took
| Component | Count |
|---|---|
| Column sections | 7 |
| Panels | 22 |
| Entities referenced | 73 |
| Live templates | 27 |
| Template sensors behind it | 25 |
| Custom cards | stack-in-card, mushroom, apexcharts-card, sankey-chart, power-flow-card-plus, card-mod |
The custom cards all come from HACS. None is essential in the sense that the data would be wrong without it. The sensors are the substance; the cards are presentation. That split is worth preserving: if a card is abandoned upstream you replace a panel rather than rebuild a system.
Takeaways
- Build the sensor layer first. Verify sign conventions by measurement, never by reading option names.
- Use column sections rather than one section per panel. It removes row-height whitespace entirely.
- Column order is the only lever for mobile. Put the most important panel first.
- Give unrelated percentages different shapes, and keep severity colours for health metrics.
- Benchmark against a modelled ceiling, and treat any impossible value as a calibration fault.
- Reconcile tariffs against a real bill and check whether the rates already include tax.
- Never hard-code a date into dashboard prose.
- Validate by rendering, not by reading. A clean config check proves nothing about whether an entity was created or a card will draw.
When it makes sense to call someone
If Home Assistant is a hobby, this is a few evenings of work and most of it is in this post. If the inverter is one of several on a commercial site, or you want the same tariff reconciliation and payback tracking across a fleet of properties, the sensor layer is what needs doing right first.
MobileTechs sets up Home Assistant, solar and battery monitoring and the network underneath it for Gold Coast homes and businesses. Get in touch or call 1300 644 588.